














An ETF table may place billions in assets beside millions in inflows and heavy exchange volume. Reading it correctly starts with the transaction each number measures and the time period it covers.
To read Bitcoin ETF flows, first identify what each column measures: assets entering the fund, the changing value of assets already held, or existing shares changing hands. Net flows, assets under management and trading volume answer different questions. Matching dollar signs and dates do not make them interchangeable.
Three columns answer three different questions
A spot Bitcoin ETF share trades on a stock exchange; the BTC held by the product is a separate asset. US spot Bitcoin products commonly called ETFs are structured as commodity-trust ETPs. The useful distinction here concerns the measurement, rather than the label on the product.
| Field | What it measures | What it does not establish |
|---|---|---|
| Net inflow / outflow | The value contributed for newly created shares minus the value distributed for redemptions during a period | The final buyer’s identity or Bitcoin’s next price move |
| AUM / net assets | Fund size at a point in time; check whether the provider reports gross or net assets | That the whole amount was invested that day |
| Trading volume | Shares traded on an exchange, or their dollar value, during a period | That an equal amount of new shares was created or BTC purchased |
AUM is a common label for fund size. In a financial report, “Net Assets” means assets after liabilities; “NAV per Share” is the net asset value represented by one share. A total measured in billions of dollars and a single-share dollar value do not belong in the same series.
Fix the scope, unit and observation date first
- Define the fund universe. Is this one fund or a total for US spot Bitcoin products? Including futures products, other countries or Ether funds changes the question.
- Read the units. A value of 120 in a “USD million” column means $120 million, not $120. BTC holdings and their dollar value are different series.
- Identify the period. Do not add daily flows, weekly totals and year-to-date flows together. Cumulative figures also need a starting date.
- Separate observation from publication. A report’s filing date is not the date its transactions occurred. IBIT’s report filed on May 7, 2026, for example, covers the quarter ending March 31, 2026.
- Do not turn missing values into zeros. An unreported fund may make an aggregate incomplete. Check the provider’s conventions for zero, blank and estimated entries.
A US exchange business day may not match the calendar date in your time zone. Fund valuation, exchange trading and Bitcoin’s continuous market can have different cutoffs. IBIT uses a 4 p.m. US Eastern Time reference for daily NAV but an 11:59 p.m. BTC valuation for its periodic financial statements. Identify which NAV is being used before selecting a compatible BTC timestamp and price source.
Read flows through creations and redemptions
A buyer on the secondary market typically purchases an existing share from another holder. That trade does not necessarily increase the fund’s shares outstanding. Creations and redemptions take place in the primary market between the fund and authorized participants.
In a fund report, “Contributions for Shares issued” records value received for creations, while “Distributions for Shares redeemed” records value leaving through redemptions. Their difference is net capital share transactions. Daily data providers may estimate flows using changes in shares outstanding and NAV; read their methodology before treating different providers as one continuous dataset.
An inflow does not always mean newly deposited cash. The SEC’s July 29, 2025 approval allowed in-kind creations and redemptions. Under the applicable product terms, an authorized participant may deliver or receive BTC instead of cash. The dollar value of that transfer can count toward flows without representing a same-day cash purchase of BTC on the open market.
Separate flows from changes in AUM
A simplified reconciliation: closing net assets = opening net assets + net capital share transactions + the net change from operations. Operations include realized and unrealized investment effects and expenses. A product with distributions or other adjustments requires those additional report items as well.
Suppose a hypothetical fund starts with $1 billion in net assets. Its existing portfolio gains 5%, expenses are zero, and a $30 million net inflow arrives at the end of the period. Closing assets are $1.08 billion: $50 million of appreciation plus $30 million of flows. Calling the entire $80 million increase an inflow overstates new fund investment by $50 million.
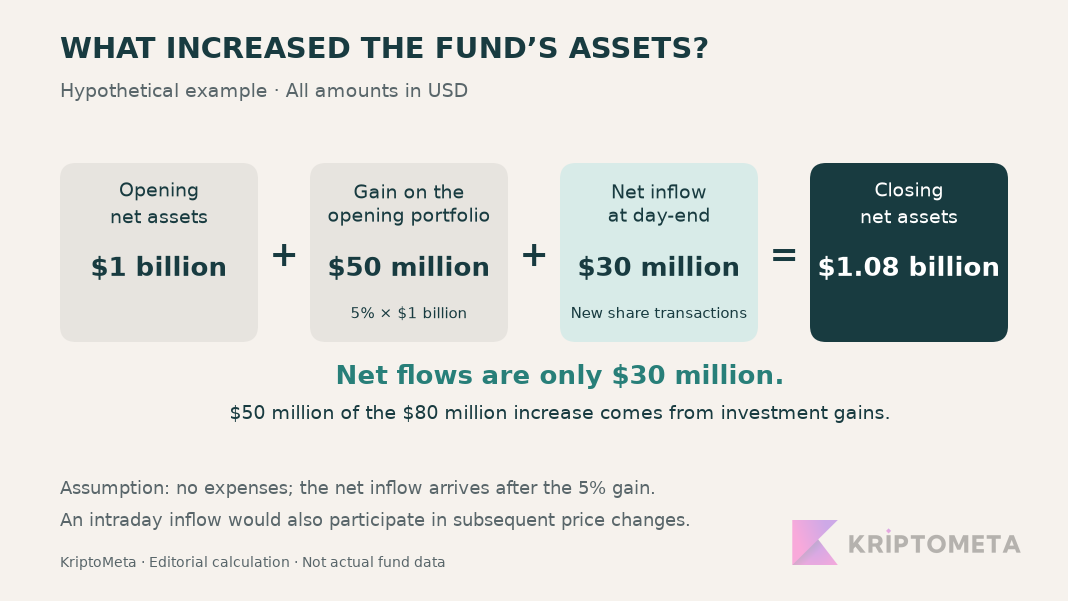
If the inflow arrives earlier, the incoming assets participate in subsequent price moves. Opening and closing AUM alone cannot produce a precise decomposition; flow timing, share/NAV data and expenses matter. Subtracting opening AUM multiplied by the BTC return from the AUM change is an approximation whose assumptions must hold.
For a real reconciliation, use the changes-in-net-assets statement in IBIT’s March 31, 2026 report. Opening assets were $67.401 billion, net capital share transactions added $1.112 billion, and operations reduced assets by $15.128 billion, leaving $53.385 billion. The unrounded numbers reconcile exactly. The fund shrank despite positive net share transactions.
Why high volume is not an equally large inflow
In a hypothetical example, one million shares changing hands at $50 each produce $50 million in dollar volume. Repeated trading of the same shares adds more volume. Shares outstanding can remain unchanged throughout; each secondary-market trade has both a buyer and a seller.
Volume helps assess trading activity, but does not guarantee a narrow bid-ask spread, order-book depth or the execution price for a particular order. A “$1 billion volume” headline does not mean the fund received $1 billion. When converting share volume into dollar volume, identify the price convention and measurement window.
Checks before using the table
Add net flows across the same fund universe, including redemptions. If hypothetical Fund A receives $100 million while Fund B loses $80 million, their combined net inflow is $20 million. A total assembled from mismatched dates or different product types is not a like-for-like comparison.
The analysis of ETF flows and price across two IBIT quarters examines which conclusions the data can support when moving from net inflows to a price interpretation.
Your final note should state the included funds, period, units and whether the figures are final or estimated. When comparing flows with price, do not use information published later as though it had been available earlier. The current Bitcoin price and a dated report serve different purposes: one shows a quote, the other records historical fund activity.