













Layer 2 economics can diverge from transaction growth. A common 30-day window for Base, Arbitrum and OP Mainnet shows what low L1 costs explain and which expenses remain outside the calculation.
Lower rollup transaction fees benefit users. Whether a network can preserve its revenue as fees fall is a separate question. Activity, average fees and publication costs can all change together; a transaction record alone does not demonstrate a sustainable business.
To examine layer 2 economics, we compared Base, Arbitrum and OP Mainnet over August 27–September 25, 2026 UTC. A common window prevents revenue and costs from being taken from different periods. The sample covers three established optimistic rollups; it is not a ranking of the entire L2 sector or of ZK networks.
What remains between fee revenue and publication costs?
A rollup executes transactions outside the base chain while using that chain to verify results and publish the required data. Batching spreads publication costs across transactions. Ethereum's optimistic rollup documentation explains the relationship between execution and data submission.
The network fee charged to a user is not necessarily the same amount the operator pays the base chain. In OP Stack, for example, L2 base fees and the L1 portion of transaction fees flow into separate vaults. The protocol's fee-vault specification identifies components of collections; a vault balance alone is not a net-profit calculation.
Scope of the calculation: The narrow spread below is fee revenue minus costs paid to L1. Staffing, servers, proof generation, development, incentives and contractual revenue sharing are not individually measured here. A positive spread does not establish the company or protocol's net profit.
Three networks over the same 30 days
We used growthepie's daily fee revenue, rent paid to L1 and transaction count series. The cost measure covers data submission and verification-related expenditure on L1; it should not be read as a measurement of blob fees alone.
| Network | Fee revenue | L1 costs | Narrow spread | L1 costs / revenue | Transactions |
|---|---|---|---|---|---|
| Base | $4,814,689 | $12,250 | $4,802,439 | 0.25% | 282,472,732 |
| Arbitrum | $553,269 | $2,285 | $550,984 | 0.41% | 46,424,763 |
| OP Mainnet | $84,177 | $3,706 | $80,471 | 4.40% | 47,946,055 |
For Base, approximately 99.75% of revenue remains after subtracting only L1 costs. Calling that a “99.75% net profit margin” would treat unmeasured expenses as zero. growthepie's onchain profit methodology likewise excludes offchain operating and development costs.
Arbitrum and OP Mainnet processed similar numbers of transactions: roughly 46.42 million and 47.95 million. Arbitrum nevertheless collected about 6.57 times as much fee revenue. Comparing the networks solely by transaction count hides pricing and transaction-mix differences. These totals do not identify which applications, users or fee policies produced the gap.
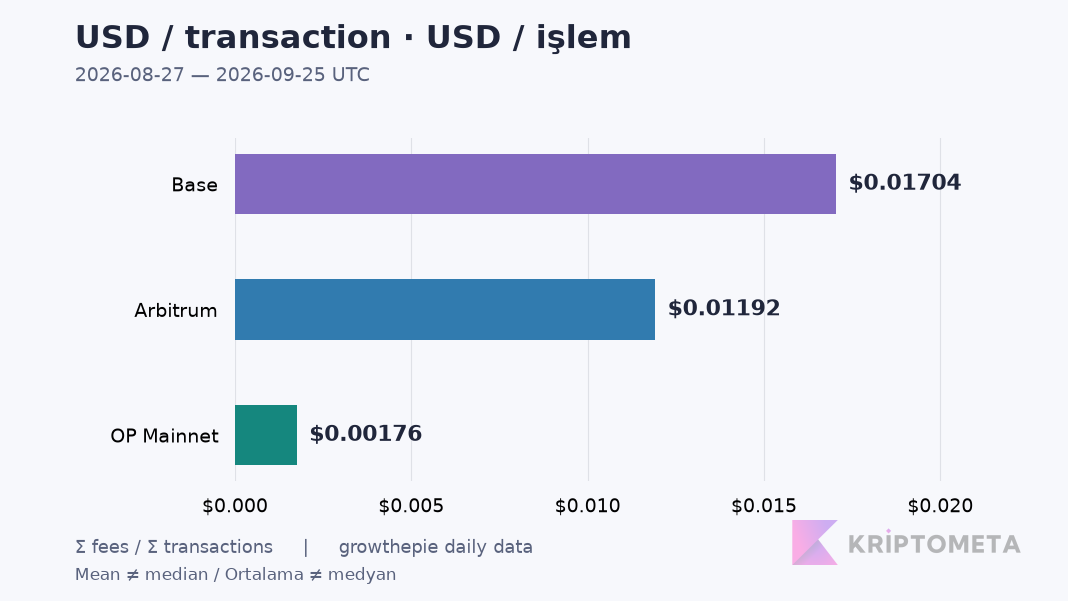
The chart divides total fees by total transactions: about $0.01704 for Base, $0.01192 for Arbitrum and $0.00176 for OP Mainnet. These are neither median fees nor live quotes for the same transfer. The average can change when the mix shifts between simple transfers and complex contract calls.
How to reproduce the calculation
- Align the dates. The review took place on September 27; the downloaded series' last common complete day was September 25. We selected the same 30 UTC dates for each network. A generic “last 30 days” label would conceal that distinction.
- Keep units consistent. We summed the API's daily USD values. We did not convert the entire period's ETH total at today's exchange rate, which would create a different dollar series.
- Check for missing days. Every selected series contained 30 numeric daily observations. We added no forward filling or zero filling. That check does not mean we independently reconstructed and audited the provider's underlying chain data.
- Calculate ratios from totals. Narrow spread = period fees − period L1 costs. Spread ratio = narrow spread / period fees. Averaging daily percentages can give low-revenue days disproportionate weight.
For all three networks, the results matched the sums of the provider's daily onchain profit series within rounding precision. Providers can revise their data. A later dashboard need not match to the cent unless the source version and observation window are preserved.
Cheap data, low fees and incentives have different effects
Cheaper publication creates room for the operator. Passing the saving through to users may reduce revenue per transaction; more users or more frequent use may offset the decline. Without measuring the demand response, lower fees do not establish that revenue will rise.
A hypothetical counterexample: One million monthly transactions at an average fee of $0.01 produce $10,000 in revenue. With $500 in L1 costs, the narrow spread is $9,500, or 95%. Suppose the same month also incurs $8,000 in operating expenses and $3,000 in incentive spending that has not already been netted against revenue. The expanded result is $10,000 − $500 − $8,000 − $3,000 = −$1,500. These figures are not a disclosed budget for any network.
If transaction count doubles to two million while the average fee halves to $0.005, revenue remains $10,000. Publication costs and operating load may change too. Activity growth alone is not revenue growth: with everything else held constant, halving the average fee requires more than twice as many transactions for revenue to increase.
The market value of tokens allocated to a reward program is not automatically a cash expense to subtract from fee revenue. Identify who funds the program, the vesting period, the amount actually distributed and the accounting treatment. Sponsored user fees may still appear as network collections; who ultimately pays for demand requires a separate assessment.
What evidence would support lasting demand?
Thirty-day totals are a starting point. Sustainability remains uncertain without evidence about whether the same users return and pay after incentives end, how concentrated activity is in one application, the distribution of fees per transaction and service costs. Addresses should not be equated with people; automation and multiple wallets can alter the interpretation.
Passing network revenue to token holders requires a separate mechanism. Paying fees in ETH or having a governance token does not demonstrate that the spread automatically accrues to that token. Our Ethereum demand and network-economics analysis examines the distinct question of value flowing to the base chain.
The selected period shows L1 costs below fee revenue for all three networks. A stronger sustainability assessment requires repeated observations using the same method, evidence of use continuing after incentives and the expenses omitted from the calculation. Low fees deliver a tangible benefit to users; the operator's full economic result needs a wider set of evidence.
Economic data alone does not establish a network’s available exit route. The rollup selection guide examines verification, data availability and upgrade authority separately through a real risk profile.