










A strong UNI thesis needs more than a busy exchange protocol. Fee allocation, recurring burns and the economics of supplying liquidity belong in the same assessment. This analysis examines when growth might translate into token value and what could interrupt that connection.
Billions of dollars traded through Uniswap do not become billions of dollars of income for UNI holders. The economic question is narrower: which fees does that activity generate, and how much of the fee flow reaches token burns? Assessing UNI’s outlook starts with that connection, rather than the size of the trading headline.
Method and evidence limits
This analysis draws on Uniswap documentation and governance discussions reviewed on September 25, 2026. It is not a live price forecast, a comprehensive onchain data study or a security audit. We start with the distinction between the Uniswap protocol and UNI, then examine fees, supply and competition.
All calculation examples are hypothetical. The separate UNI price and chart page covers market data. Here, the aim is to identify developments that could strengthen or weaken the economic case for the token.
Uniswap volume is not income for UNI holders
Trading volume measures the value exchanged, not profit. The same capital can trade repeatedly during a day. A swap routed through several pools may produce a separate record for each leg. Neither fresh capital inflows nor a count of people can be inferred directly from that total.
Match the time window, chain and protocol versions before comparing charts. A v3-only series and a series covering every version answer different questions. Our Dune review illustrates how to inspect a dashboard’s source and query scope.
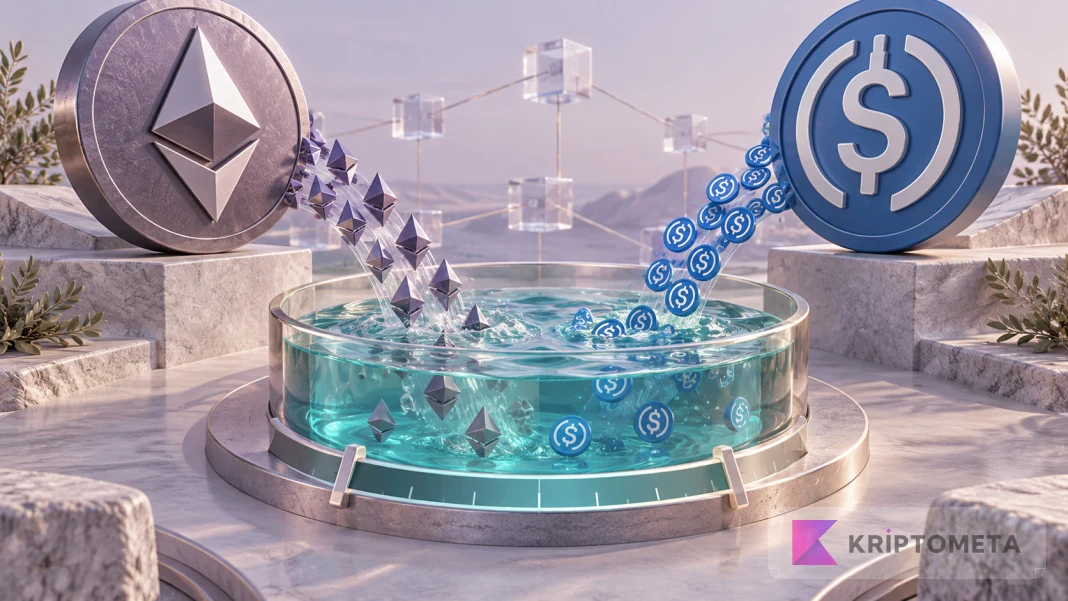
For UNI, the next question is who receives the fees. Liquidity-provider earnings, the protocol’s collected share and a token holder’s market return belong in separate columns. Combining them under “revenue” can make the investment argument look stronger than the underlying flows justify. For the LP side of that distinction, our liquidity provision guide works through active ranges, fee allocation and performance against holding.
How protocol fees connect to UNI burns
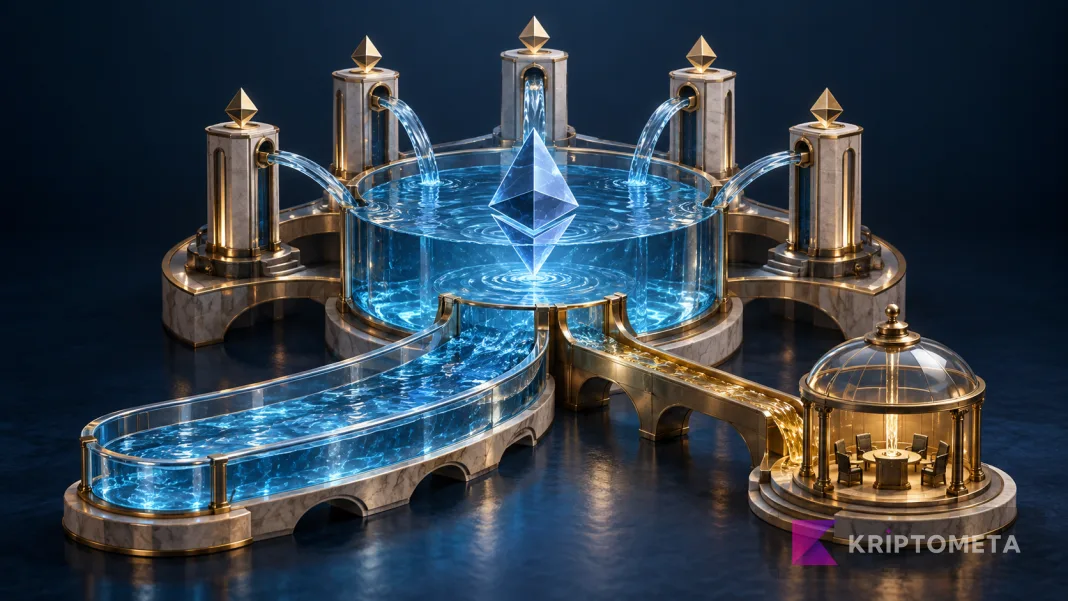
In Uniswap’s fee architecture, assets from applicable sources accumulate in TokenJar contracts. Under the relevant release mechanism, a participant burns the required amount of UNI to claim collected assets. The documented fee flow does not distribute automatic dividends to token holders.
The participant’s incentive depends on the difference between the assets received and the cost of UNI plus execution. Collection and burning are separate transactions, so fee accrual should not be treated as an instantaneous, identical amount of completed burns.
For fee-enabled v2, the documented split of the 0.30% swap fee is 0.25% to the LP side and 0.05% to the protocol side. The following example applies that split to $1 million of hypothetical dollar-equivalent volume. It is neither a report of current activity nor a claim that the pool offers a bank-dollar pair.
| Item | Calculation | Amount |
|---|---|---|
| Total swap fees | $1,000,000 × 0.30% | $3,000 |
| LP share | $1,000,000 × 0.25% | $2,500 |
| Protocol share | $1,000,000 × 0.05% | $500 |
Gas, price impact and changes in the value of the LP’s assets are excluded. Do not carry these rates unchanged into v3 or v4 pools. Contract deployment on a chain is not, by itself, proof that fee collection has been activated.
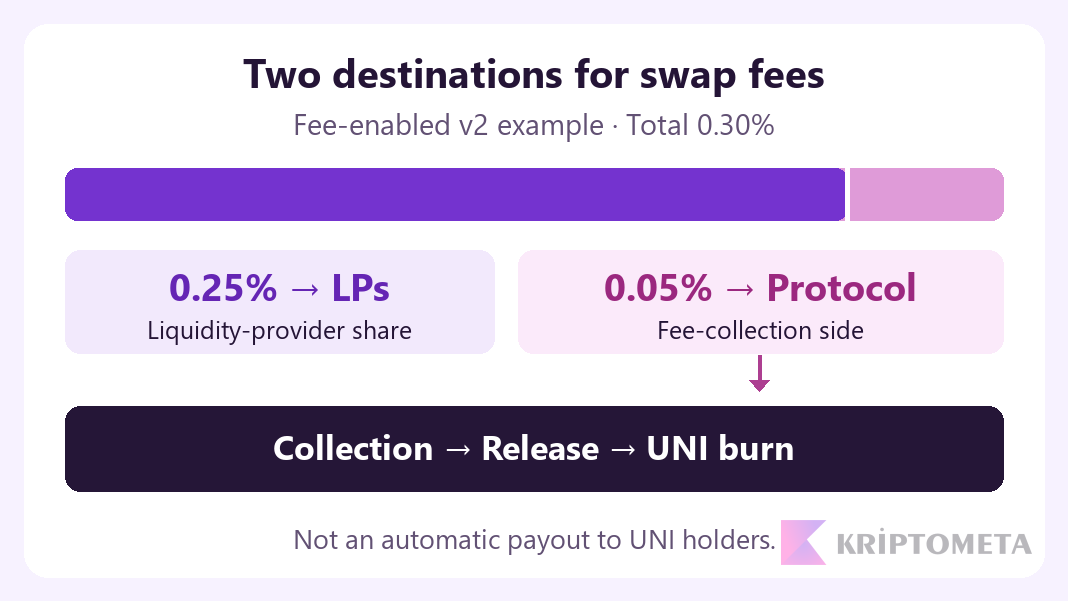
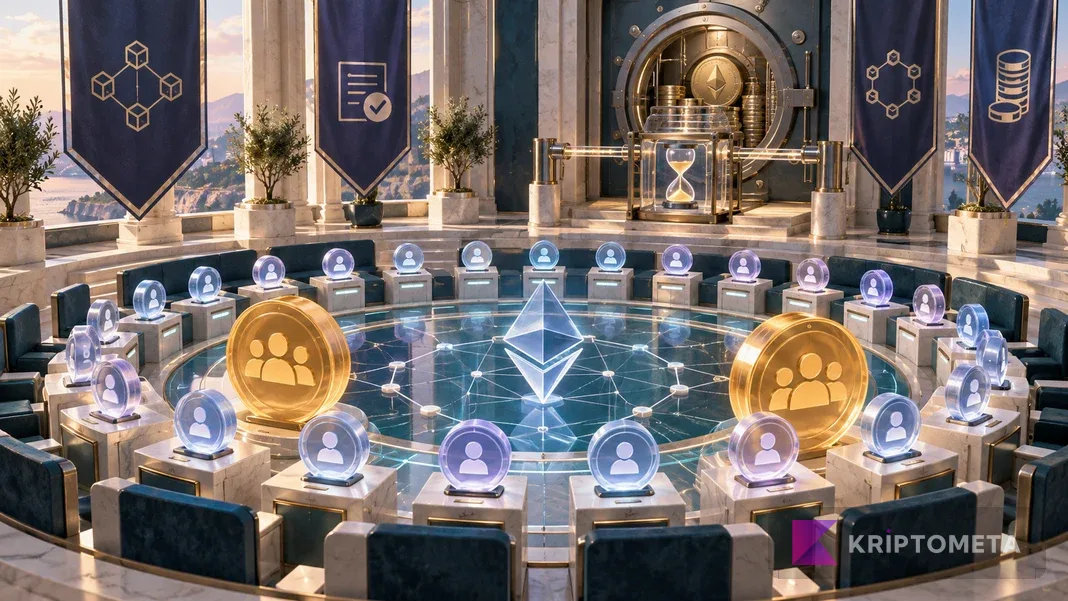
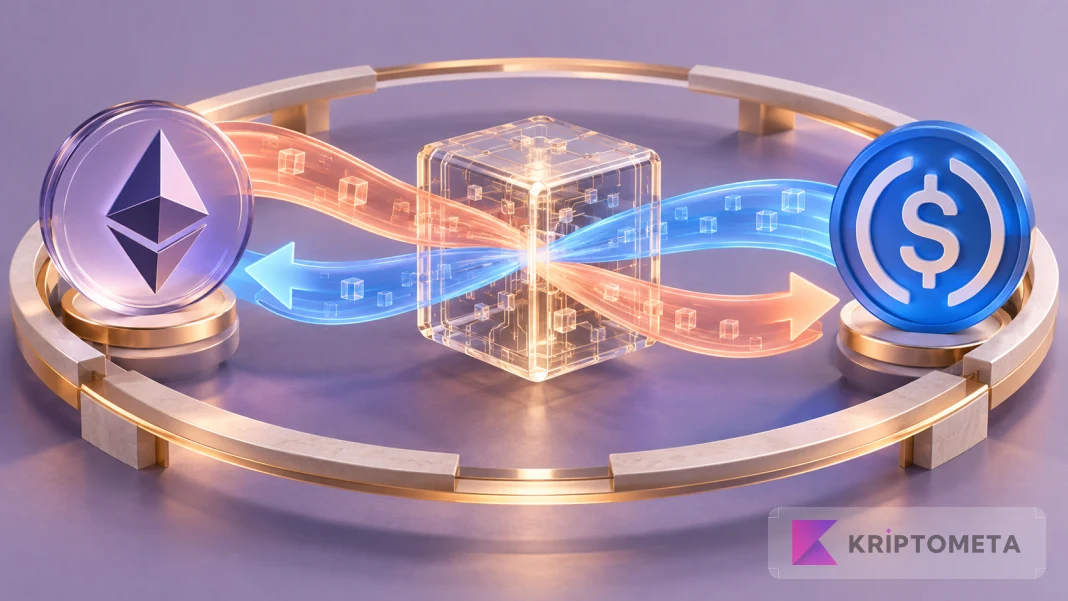
The diagram separates the economic fee flows. A user’s gas payment and UNI’s market price sit outside this illustration.
Read burns alongside supply and treasury flows
Token burns and new issuance move in opposite directions. At the review date, the official UNI documentation describes no active inflation, while governance retains authority to mint up to 2% of total supply annually. That authority is not the same as automatic annual minting. An immutable supply cap would be the wrong assumption.
Treasury spending needs its own column. Moving existing UNI from the treasury to another wallet does not mint new tokens, but it can affect how many tokens become available to the market. Our tokenomics research guide explains the broader distinctions behind supply figures.
We do not annualize a one-off treasury burn as evidence of recurring trading income. Sustained fee generation tells a different story. Check how a data provider handles tokens sent to an inaccessible address before comparing its “total supply” number with another dashboard.
Why liquidity providers matter to the token thesis
A larger protocol share can leave LPs with less fee income when other conditions stay the same. If liquidity leaves, execution may deteriorate and routers may find better quotes elsewhere. A seemingly attractive fee increase can then apply to a smaller trading base. These are competitive risks to monitor, not claims that such an outcome has already occurred.
In the July 2026 discussion of v4 fees, Panoptic’s founder raised concerns about LP economics. Uniswap Labs countered with observations from large v3 pools. The disagreement exposes a real trade-off between token economics and retaining liquidity; selected pool observations do not establish a permanent outcome for every market.
Interface usability is another question. Our Uniswap interface review covers quotes, network selection and practical limits. Liking the product does not make every price paid for UNI reasonable.
Three UNI scenarios and what would change them
- Constructive scenario: Fee-generating use expands across several periods, relevant pools keep competitive quotes and burns continue. Falling protocol receipts or thinner liquidity despite higher volume would challenge that view.
- Middle scenario: Activity persists, but a shift toward lower-fee pairs, competition and treasury flows limit the economic benefit. The token need not rise in proportion to volume. A lasting improvement in fee capture and burns would matter more than transaction growth alone.
- Adverse scenario: Liquidity and order flow move to competitors, contract or governance problems emerge, or demand for UNI weakens. Burns may continue without offsetting selling pressure. A recovery thesis would need evidence of returning liquidity and repeated use.
These scenarios carry no assigned probability or target price. A protocol can improve while its token is already priced for more. A difficult period does not prove that the market has fully priced its risks either.
What to track when assessing Uniswap’s outlook
Our assessment follows a consistent sequence: comparable 30- and 90-day volume, protocol fees collected, UNI actually burned, liquidity in the relevant pools and treasury flows. Match the start and end dates before comparing growth rates. Look for changes across several periods, rather than relying on a single-day spike.
To test the scale of a price expectation, combine an assumed circulating supply with the proposed price in our market-cap calculator. The result is not a probability of reaching that price. The harder question is whether sustained use and economic capture could support the implied valuation.
