












The Ethereum outlook depends on whether more activity creates more demand for ETH. Lower fees, staking and layer 2 growth need not produce the same economic outcome. This analysis tests the link between use and value through three conditional scenarios rather than a chosen price target.
An Ethereum investment thesis built only on transaction counts misses a crucial step. Heavy network use need not create equally strong demand for ETH. Lower fees can benefit users while reducing the amount of ETH burned. KriptoMeta’s assessment focuses on how network activity translates into demand for the asset. Instead of choosing a price target, we examine what would support each thesis and what would undermine it.
Assessment date: September 24, 2026. The framework compares the protocol documents linked below; it is not a performance report based on a fresh on-chain dataset. The scenarios are neither probability estimates nor trading recommendations.
Which uses create demand for ETH?
ETH pays for transactions on Ethereum and supports participation in network validation. Holding it as collateral in lending applications creates another demand channel. ETH bought briefly to pay fees, ETH committed for longer periods and ETH held for short-term trading represent different economic behavior.
For example, an application that pays fees on a user’s behalf can let that user operate without holding ETH. The fee obligation moves to the application rather than disappearing. An operator able to process many transactions with a small ETH balance need not increase that balance in proportion to transaction volume. Transaction counts and the ETH balance needed to support them are separate measures.
Growing stablecoin transfers do not directly establish growing ETH purchases either. The asset transferred and the asset used to pay execution fees can differ. Our tokenomics assessment method provides a starting framework for separating use, supply and allocation.
How should issuance and burning be read together?
New issuance adds ETH to supply while fee burning removes it. Under the EIP-1559 fee design, the base fee is burned and the priority fee goes to the validator. Treating the entire transaction fee as burned ETH overstates the reduction in supply.
In a simplified hypothetical period, 100 ETH issued and 130 ETH burned would produce a net effect of −30 ETH from those two flows. If burning fell to 60 ETH with issuance unchanged, the effect would become +40 ETH. These are illustrative numbers, not current network measurements. Ethereum’s issuance explanation likewise treats issuance and burning together when describing supply changes.
That does not mean ETH supply must always decline. Token burning offers no guarantee of price appreciation when demand weakens. Turning one unusually busy day into an annual forecast can also mislead: temporary congestion needs to be separated from lasting user demand.
What does layer 2 growth mean for ETH?
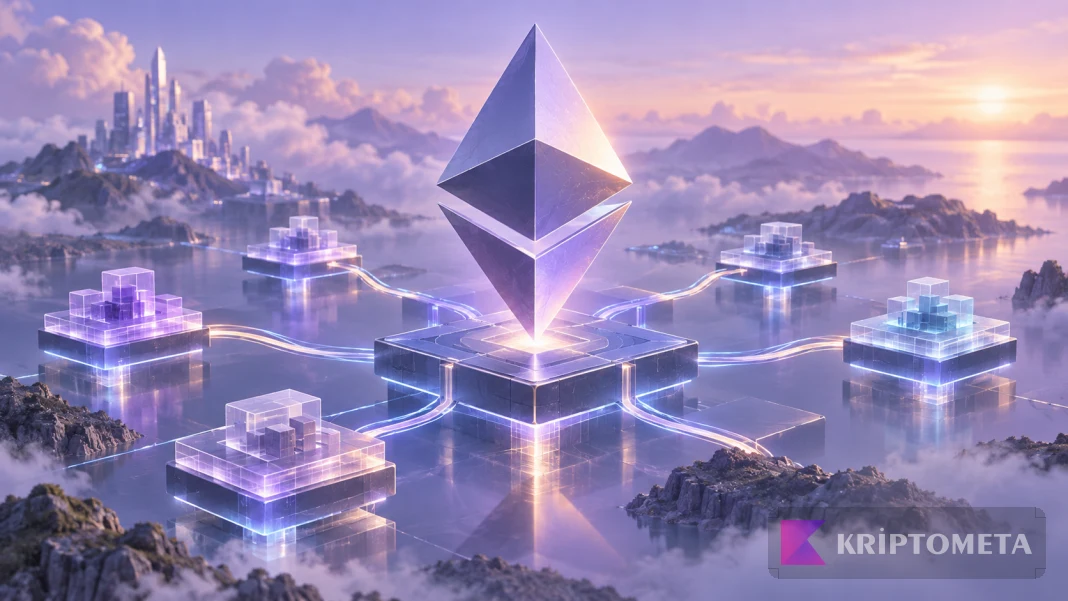
Rollups execute many transactions outside the main network while maintaining a data or verification relationship with Ethereum. Lower costs can make additional activity viable. For an investor, the question is how much demand for Ethereum’s services and for ETH that extra activity creates.
EIP-4844 defines a separate fee market for blob data. Rising L2 transaction counts do not require mainnet execution fees to rise at the same pace. Blob capacity, data demand and fee levels need to be read together. Nor should the full fee paid by an L2 user be assumed to burn on Ethereum.
The layer 2 economics analysis makes that distinction concrete by comparing user fees and costs paid to the base chain for Base, Arbitrum and OP Mainnet over the same period.
The positive interpretation is that cheaper transactions support lasting application demand and strengthen Ethereum’s role as a settlement layer. The more cautious interpretation is that usage can expand while fees flowing to Ethereum remain limited. Transaction counts alone cannot settle the debate. The data and security relationship described in Ethereum’s L2 overview should be examined for each network.
For the cost of an individual transaction, our gas fee calculator provides a separate practical tool. That transaction cost is not a valuation of the network or an ETH price target.
When following Ethereum network news, distinguish an announcement from activation on mainnet. Revise fee assumptions using the rules actually in force.
Which risks belong alongside staking returns?
Staking can earn rewards denominated in ETH for validation duties. According to Ethereum’s staking documentation, activating a validator requires 32 ETH, while pools can offer participation with smaller amounts. Operational responsibilities, deductions and service risks differ between options.
The liquid-versus-solo staking guide compares the operational choice through exit routes and worked cost examples.
A growing ETH balance is not the same as a gain in dollars or another local currency. Staking rewards may not offset a fall in ETH’s price. Penalties for being offline and slashing for serious protocol violations are different events. Liquid staking adds contract and operator exposure, as well as the risk that the received token trades at a different market value from ETH. The pool risk explanation helps distinguish those exposures.
Our APR/APY calculator can compare outcomes under assumed rates. A calculation is not a promise that a protocol will maintain its returns. Simply holding ETH does not start staking.
Three conditional scenarios for Ethereum
The scenarios below distinguish conditions that can be checked rather than predict price bands. Different indicators may point in different directions at the same time; one favorable observation does not establish an entirely positive thesis.
| Scenario | What supports it | What weakens it |
|---|---|---|
| Usage creates economic demand | Recurring application use, ETH collateral needs and demand for data on Ethereum grow together. | Transactions rise while ETH holdings and network fee demand remain persistently weak. |
| Scaling grows, value capture remains limited | L2 use expands, but low transaction costs constrain the total fees paid to Ethereum. | Data demand and lasting demand for ETH strengthen enough to invalidate limited value capture. |
| Demand and competitive pressures dominate | Users or applications move to other solutions; fee and collateral demand weaken. | Users return consistently, durable applications grow and preference for Ethereum strengthens. |
The price outcome in each case also depends on liquidity and expectations already reflected in the market. Strong network data do not by themselves establish that ETH is cheap when its valuation assumes a very optimistic future. ETH is not a share conferring rights to company dividends; network fees should not be valued as a direct dividend stream to every holder.
Which indicators should change the thesis?
- Persistence of use: Separate temporary incentive-driven activity from recurring application use.
- Issuance and burning: Compare matching periods, units and windows rather than extrapolating a daily spike.
- L2 data economics: Examine demand for data on Ethereum and fees paid alongside transaction counts.
- Staking structure: Consider operator concentration, service terms and exit risks as well as participation.
- Competition and application security: A functioning network does not establish that every contract is safe.
KriptoMeta’s approach starts by identifying which indicator tests which claim. Interpreting every metric positively after a price rise, or dismissing economic use after a fall, weakens the assessment. This dated framework remains separate from the changing figures on our Ethereum price and chart page.