








Heavy Solana traffic is not the same as a strong investment thesis. Fee recipients, new SOL issuance and usage that survives incentives shape the economic outcome. Three scenarios show where network success and token-holder returns can diverge.
Assessing Solana’s future starts with who benefits from network activity, not just how busy the chain looks. Low fees can attract users who each need only a small amount of SOL. KriptoMeta’s analysis tests the assumption that network growth must lead to a higher token price against fee distribution, new supply and user behavior. Three scenarios at the end identify the evidence that would support or weaken that view.
How does Solana usage translate into demand for SOL?
Solana is the network that runs applications; SOL is its native asset. Transaction fees are paid in SOL, and staking gives SOL a role in network security. That connects the asset to usage. It does not mean every dollar of application volume creates a dollar of SOL purchases or income distributed to SOL holders.
Consider a stablecoin payment. The payer holds the payment amount in a stablecoin and may need SOL only for fees. If an application sponsors the fee, the application holds the fee budget instead. A large number of payments can demonstrate a useful network without creating an equivalent amount of demand to hold SOL.
We separate three questions: what brings users back, how much SOL that activity requires them to hold, and who retains the resulting income. The general tokenomics review method applies the same distinction across projects. Here, the focus is Solana’s fee and validator structure.
How much of the transaction fee is burned?
The Solana fee documentation, checked on September 24, 2026, specifies a base fee of 5,000 lamports per signature, split equally between burning and the validator. The entire priority fee goes to the validator. Half of the total fee is not necessarily burned.
For a hypothetical one-signature transaction, add a 10,000-lamport priority fee to the 5,000-lamport base fee. Of the 15,000 lamports paid, 2,500 are burned and 12,500 go to the validator: the burn share is about 16.7%. The priority fee is an illustrative assumption, not an average network cost, application commission or current wallet quote.
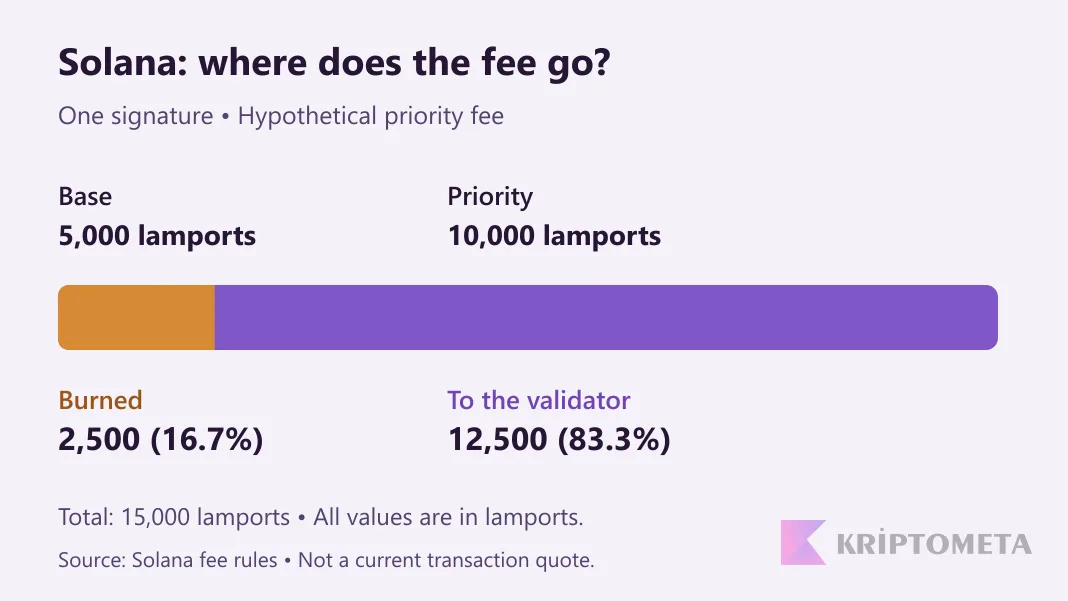
Higher priority fees can increase validator income without an equal increase in burning. Validator income is not a dividend paid equally to every SOL holder. Whether earnings reach a staking participant depends on the service and its reward-sharing terms.
How should SOL issuance and staking yield be read together?
New SOL issuance and burning must be compared over the same period before claiming that supply is shrinking. Circulating supply is a different measure from total supply. The distinction between supply types helps avoid treating locked or otherwise unavailable balances as freely circulating assets.
Solana’s staking overview describes rewards as dependent on issuance, total stake, validator performance and commission. An annual rate shown in SOL is not a return in US dollars. A larger token balance can still be worth less in USD.
Suppose your balance grows by 6% while total supply grows by 4%. Your relative share of supply changes by 1.06 ÷ 1.04 − 1, or approximately 1.92%. The illustration assumes no other balance changes and treats the 6% as net of deductions. Neither rate is a current Solana figure. The calculation explains why token growth and growth in ownership share differ; it does not measure purchasing power or price returns.
The staking APR/APY calculator helps compare nominal rate assumptions. It should not be treated as a calculation of ownership share or a forecast of SOL’s price.
Does transaction count measure real users?
No. A network counter records transactions, not unique people. Solana’s performance samples expose separate counts for total and non-vote transactions. Removing votes is a useful first adjustment. Treating every remaining transaction as human activity creates another error: automated systems also submit non-vote transactions.
Compare metrics with matching definitions and time windows. A daily total should not be compared with another chain’s momentary peak. Returning addresses, successful transactions and activity across applications can help assess usage together. Addresses are still not people; one person can control many.
- Volume: Does the measurement separate incentive-driven activity or repetitive trading?
- Completion: Did users actually complete the action they intended?
- Persistence: Does usage continue after a campaign ends?
- Distribution: Is activity concentrated in a few applications or large accounts?
Instead of treating a one-day record as proof of lasting demand, examine the methodology and the direction across several periods. Two large numbers with unexplained definitions do not make a reliable comparison.
What determines network reliability and competitiveness?
For users, reliability means completing an intended action when needed. A wallet, access provider or application can fail while the blockchain continues producing blocks. Calling every interface problem a chain outage is misleading; assuming all users had a smooth experience because blocks were produced is also incomplete.
The Solana Foundation’s June 2025 network report offers a dated starting point for availability and validator clients. It is not evidence of uninterrupted service today. Updating the analysis requires checking the reporting period and measurement method alongside the publication date.
Beyond validator count, we examine who controls stake and how independent the software implementations are. Differently named clients may share code and exposure to the same defect. Many nodes run by one operator do not provide the ownership diversity of separate operators. Hardware and operating costs also affect whether smaller participants can remain in the network.
A Solana–Ethereum comparison needs more than a fee or speed column. Application security requirements, developer tools and the destination of economic value can change the conclusion. The Ethereum network economics analysis examines a different structure through the relationship between layer 2 activity and demand for ETH.
Three scenarios for Solana’s outlook
Scenarios are not price promises. They define which observations would strengthen or weaken a thesis. Some indicators can improve while others deteriorate.
| Scenario | Supporting observation | What weakens the thesis? |
|---|---|---|
| Lasting usage strengthens | Users return after incentives decline, with activity spread across applications. | Growth is concentrated in a few campaigns or automated accounts. |
| The network grows, but value reaching SOL is limited | Volume rises without comparable growth in required SOL balances or holders’ economic share. | Persistent demand and the supply balance strengthen together. |
| Competition and operating pressure increase | Repeated access problems, lost activity or greater stake concentration appear. | Independent measurements show better continuity and participation diversity. |
The strongest case for Solana is usage that persists beyond temporary surges and makes a measurable contribution to SOL’s economics. The weakest case starts with a chosen future price and collects only the counters that support it. The live SOL price and chart are available on the market page; price movement alone does not validate a thesis about the network.