










Two readers can draw very different conclusions from the same DeFi dashboard. The useful part of DeFiLlama is learning which scope and metric definition sit behind the headline number.
Our DeFiLlama review started with a practical question: does the tool make meaningful protocol comparisons easier? We opened the main TVL dashboard and Aave’s protocol page, then tried the coverage filters, currency display and chart grouping. Its most useful feature is not the sheer number of figures. It is the ability to investigate what activity and scope each figure represents.
How we assessed DeFiLlama
The review was conducted on September 24, 2026 using public web dashboards. We did not create an account, connect a wallet or deposit funds. Paid subscriptions and API performance were outside the test. The screenshots are real captures, and their figures belong to that observation date; they should not be treated as live readings.
We used three criteria: can comparable protocols be viewed on the same basis, can the calculation method be found, and how easily could a chart lead to the wrong conclusion? Unlike Etherscan’s transaction and contract investigations, the focus here moves from individual transactions to protocol and network totals.
What do the TVL filters change?
The Include in TVL menu determines which components enter the total. Our session displayed Staking, Pool2, Active Loans, Double Count, Liquid Staking and Vesting. Before comparing two readings, check that the same options are enabled.
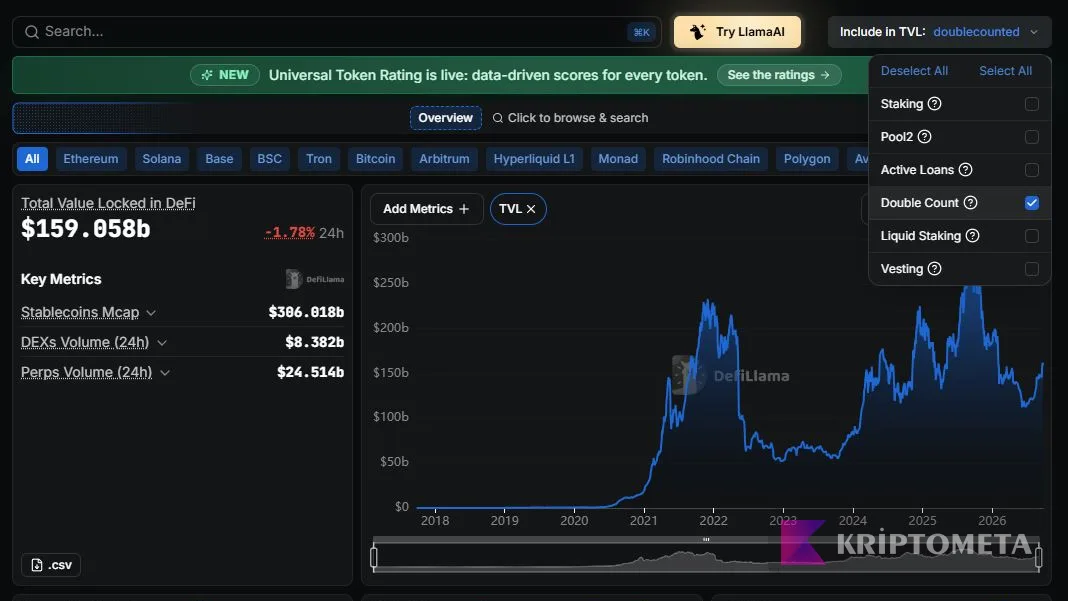
The live DeFiLlama interface captured on September 24, 2026, with the coverage menu open in the upper-right corner.
Enabling Double Count alone changed the displayed total from approximately $95.113 billion to $159.058 billion. That difference was not a rush of deposits over a few seconds. We had changed the set of records included in the measurement. When comparing screenshots from different dates, recording the filters is as necessary as recording the headline value.
- Select the chain scope first. All chains and Ethereum alone are different populations.
- Note the enabled Include in TVL options.
- Use the same scope on the second screen, or explain why it differs.
Token prices can move TVL too. Suppose a contract holds 100 ETH. If ETH rises from $2,000 to $2,200, the measured value rises from $200,000 to $220,000 without the quantity changing. New ETH deposits in that hypothetical example are zero. A TVL chart alone cannot settle a question about net inflows.
Which details on a protocol page are useful?
The aggregate Aave view was labelled Aave (Combined). Product versions and a Methodology section appeared further down the page. Comparing the combined protocol with a single version can turn a difference in scope into an apparent difference in performance. Recording both the product and version helps avoid that mistake.
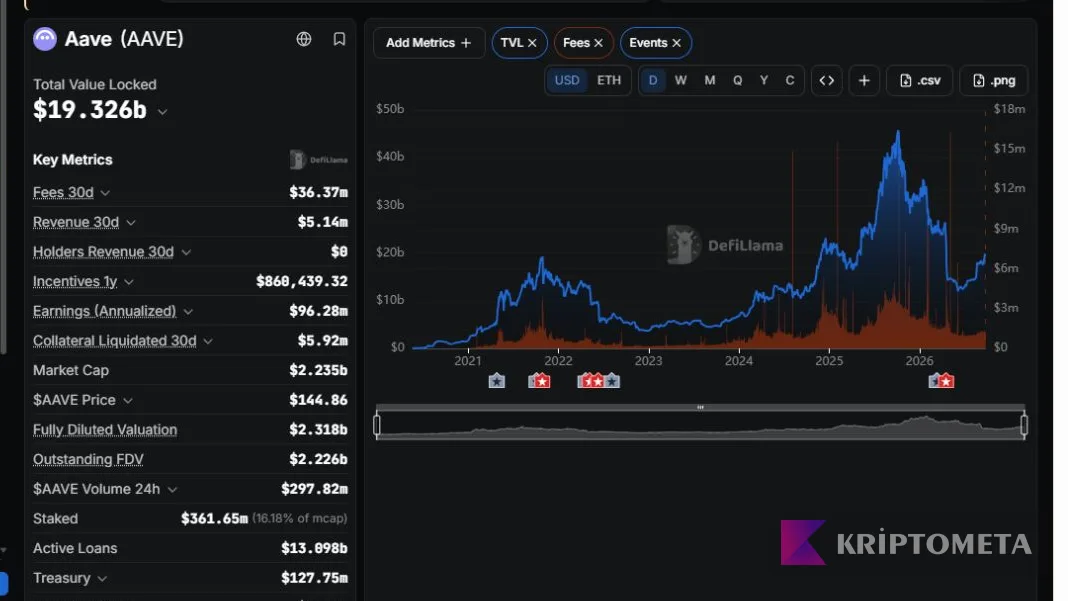
Aave’s actual DeFiLlama page: Fees 30d and Revenue 30d appear on the left; currency and grouping controls sit above the chart. Captured on September 24, 2026.
We could switch the chart denomination from USD to ETH and change daily grouping to monthly. Switching the unit changes the perspective; it does not automatically remove every price effect. Assets inside an ETH-denominated total can still change in value relative to ETH.
Being able to scroll to Methodology is a strength. You can inspect which activities enter a calculation instead of stopping at its value. The page is dense, though: TVL, fees, token price and treasury figures share the same screen. Starting with one question makes it easier to navigate. If the question is how much fee income stays with a protocol, chasing its token-price chart is a distraction.
Why fees and revenue need separate readings
Under DeFiLlama’s definitions, Fees tracks what users pay, while Revenue tracks the portion retained by the protocol. Value directed to token holders has a separate Holders Revenue metric. Calling all three “earnings” hides who receives the money.
Our Aave capture showed $36.37 million in fees and $5.14 million in protocol revenue over 30 days. Using those rounded figures, 5.14 ÷ 36.37 is approximately 14.13%. That ratio describes the share of reported fees classified as protocol revenue for the period. It is neither the return on holding AAVE nor an accounting net profit margin.
Do not add fees, protocol revenue and token-holder revenue together to manufacture a larger income total. One metric can be a subset of another, so the same economic flow would be counted again.
Assessing a token’s economic role requires more than revenue: supply, distribution and the rights attached to the token matter too. That is where tokenomics research becomes useful. DeFiLlama provides comparison data; it does not answer the investment thesis for you. Our Aave analysis follows the separate steps from borrowing interest to treasury resources and token value capture.
Our check sequence when TVL rises
A rise in protocol TVL does not immediately establish new adoption. We first hold the network and version coverage constant, then separate dollar-price changes from changes in the assets held. DeFiLlama defines USD Inflows using daily asset-balance differences valued at asset prices. Where provided for the protocol, it complements the TVL chart. A missing inflows field does not mean zero deposits.
Extend the hypothetical example: 100 ETH at $2,000 gives $200,000 TVL. If 10 ETH is added and the price rises to $2,200 the next day, TVL reaches $242,000. Of the $42,000 increase, $22,000 is the added 10 ETH valued at the second day’s price. Repricing the original 100 ETH explains the remaining $20,000. The calculation shows why the headline TVL percentage cannot measure adoption on its own.
We then return to fees and revenue. More deposited assets do not necessarily mean more use of a service. Monthly comparisons require the same 30-day window, product version and activity definition. If the metrics move in opposite directions, the divergence becomes a research question rather than an inconvenience to hide.
Which number should you trust when sources disagree?
If a protocol dashboard, DeFiLlama and Dune give different totals, compare their dates, coverage and definitions before choosing one. Averaging numbers based on different contracts or methods does not resolve the mismatch. Record the protocol version, chains, enabled TVL options, period and observation date so another reader can repeat the comparison. A consequential interpretation needs a traceable method, not just a large headline figure.
DeFiLlama’s strengths and limitations
| Criterion | Useful feature | Limitation |
|---|---|---|
| Coverage | Researching chain and protocol data together | Different filters and versions can invalidate comparisons |
| Transparency | Access to methodology and adapter code | A visible calculation method does not guarantee error-free data |
| Economic distinctions | Separating fees, revenue and value for token holders | Revenue cannot be read directly as a price target or net profit |
| Readability | Charts, filters and data cards in one place | Dense screens need more careful reading on small devices |
For KriptoMeta, the strongest feature is the route from a number to its underlying definition. The main limitation is how conclusive the figures can appear on their own. Large TVL does not establish contract safety, and high fees do not promise high income for token holders.
Who is DeFiLlama useful for?
It is useful for shortlisting DeFi projects, comparing protocols in the same sector and adding measurable evidence to research notes. For a newcomer, opening every menu in sequence is unlikely to help. Pick a question, then inspect the two or three metrics that address it.
For a closer look at the query behind a dashboard, our Dune review follows the source table and last execution time on a real DEX screen. Comparing figures across the two tools requires matching their period and measurement scope.
Transaction-level details may still call for a block explorer; protocol economics may require a tokenomics analysis. Treating DeFiLlama as a research starting point is more defensible than treating its rankings as trading signals.